Article 4 – Trader's Edge Trading Tools
Trader's Edge Trading Tools
Ryder Cup 2018 - The ultimate team contest! – 27-30 September 2018
FP Markets brings you the powerful Traders Edge Tools - a suite of twelve online trading tools designed to enhance the trading experience by giving traders the edge.
The On-Course View
The Ryder Cup is the most famous team competition in golf. It is a biennial men's golf competition between teams from Europe and the United States. The Ryder Cup is named after the English businessman Samuel Ryder who donated the trophy. The competition is contested every two years with the venue alternating between courses in the United States and Europe.
The Ryder Cup is exceptional in the modern game of golf as its players receive no payment for playing in the event. They do so for the prestige of representing their Continent. As such, it is a fiercely-contested competition where the margins for success or failure are tiny and the consequences of those can be career defining.
The Ryder Cup is unique as the golfers play in pairs throughout the three day event apart from the final day when they revert to playing regular singles match play. Choosing who plays with who and in what order presents the Captain of each team with a number of challenges and success or failure depends on it!
To do this, the team Captain will have to use an analysis similar to that used in trading:
Technical Analysis
For players to play effectively together they need to share some technical attributes. Matching a long-hitter with a short-hitter can be detrimental as their two styles of play can be so different that it is hard for both to adapt and adjust to each other’s style of play. Matching players who have similar technical skills and abilities can help players to bond and feel comfortable with each other’s games.
Technical tools such as data analysis techniques such as annual strokes gained stats and for the different aspects of the game like driving, proximity to the hole stats and putts made percentages will help the Captain see past the players personalities and other attributes to see what type or style of golfer they are and who to match them with.
Fundamental Analysis
The course layout will largely determine what style of golfer is most likely to adapt to the type of golf course. Does it suit a “bomber” or a short but straight player? Are the greens the challenge, so is putting going to be the determining factor? Also the time of year affects the weather conditions which in turn will have an affect on how the course plays and how the players will need to adapt to the style of the course and the conditions they encounter when playing it. All of these factors must be taken into account when preparing and selecting the teams for the event.
Team Captains will use a range of data analysis tools to determine each players suitability to the course style and the likely conditions in which they will find the course. Past performance records on the course can be an obvious place to start. Players tend to be either indifferent or love or hate golf courses and their performance records can help reveal this to the Captain.
Sentiments Analysis
Golfers as human beings experience strong emotions when playing golf. The Ryder Cup is one of the most pressure-filled events on the calendar with two continents competing against each other in a winner takes-all battle. This invariably comes down it one single shot by one player. Successfully play the shot and they will be forever remembered, miss and they will too - for the wrong reasons. When selecting players and the order in which they will compete, in its vital that the Captain takes into account human factors such as form, confidence and self-belief. In this high-pressure cauldron, the ability to hold one’s nerve is paramount if the team is to be successful. As Harry Vardon noted:
"There are two types of golfer, those that hold their nerve and win golf tournaments and those that don’t."
On the final day, selecting the order in which the players play is probably the greatest challenge the Captain will face. Getting points on the board early can be invaluable so does he opt for form players or experienced ones? Do you throw your novices out early and hold your form and experience back for the matches that will invariably decide the event? All these are questions that will need to be answered.
These decisions are best made in consultation with other Assistant Captains who have experience of competing at this level. All of the above data needs to be refined through the council of these experienced individual who can provide the sentimental feedback.
Then, like the trader, the Captain has to make his picks.
The On-Market View
One of the biggest challenges for traders today is the ability to filter out the right type and amount of information from the markets, in order to make an informed trading decision. What proves to be an added obstacle is to apply the exact tools or accurate data to practical trading. ‘Information- overload’ seems to be the main culprit in contributing to ‘market-noise’ as well as confusion by traders, in forecasting the direction of the markets.
The purpose of this article is to guide you to the relevant tools that could be useful in providing more clarity on market trends and sentiment. Before we go straight to the tools that are available, it must be noted that there are different tools available depending on the type of market analysis that you are intending to conduct.
The three types of market analysis are as follows:
- Technical Analysis
- Fundamental Analysis
- Sentiments Analysis
1. Technical Analysis
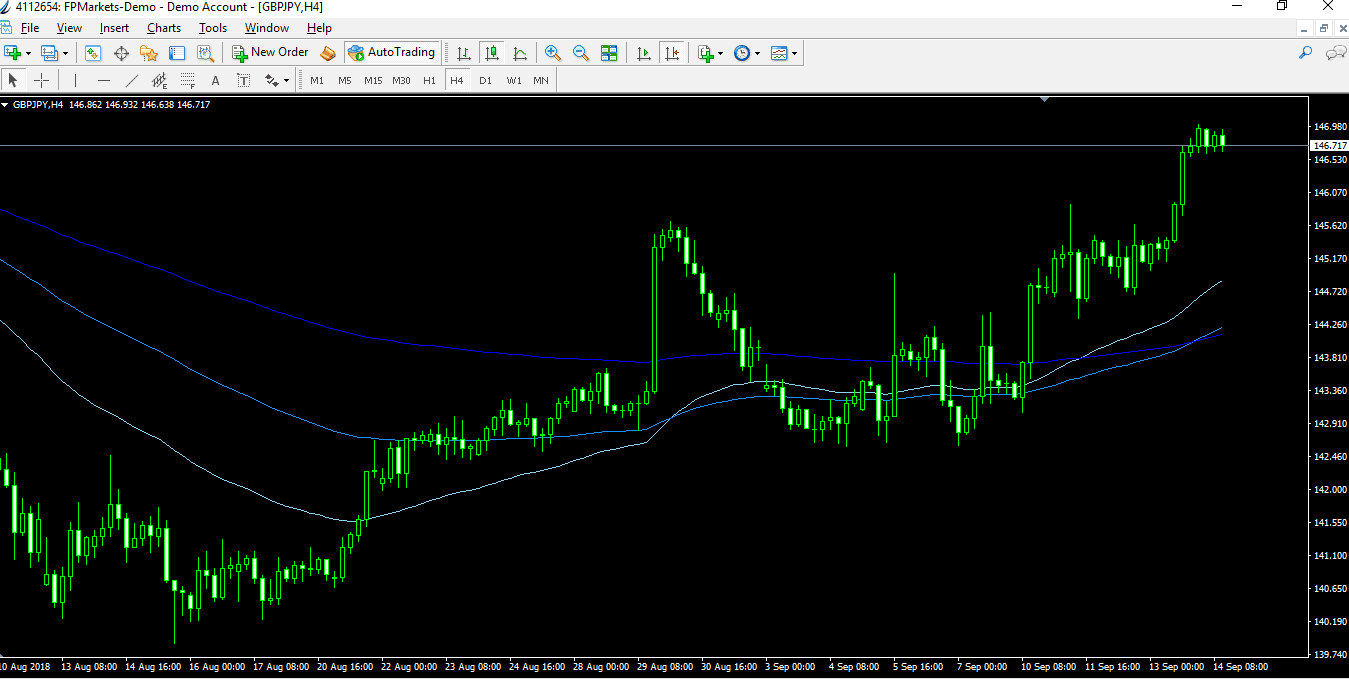
Technical Analysis, in layman’s terms, is anything that would involve looking at your charts available, for example, on FP Market’s Trading Platform. You need to be looking at the representation of Price for any instruments that you intend to trade.
Tools available for Technical Analysis
Whether it’s the tick chart, line chart or most commonly-used Candlesticks charts are able to show traders in real-time some of the following data:

As seen above, a candlestick chart for example firstly communicates to the trader the Trend with the collective movements of the candlesticks. The rise and fall of these candles are simply made of Price. However, Price is thought to move in Trends; Trends Move in Waves and finally Waves move in Cycles.
Technical indicators are an essential part of technical analysis and are typically plotted as lines, bars, histograms or in any other forms to try to predict the market trend.
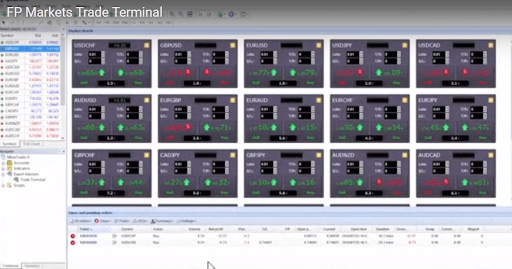
The trade terminal shows all activity on a trader’s account, not just orders placed using the trade terminal itself. For example, if you are running an automated system or manually place trades using MT4’s own built-in features - this activity will be displayed in the trade terminal’s account summary and order list.
2. Fundamental Analysis
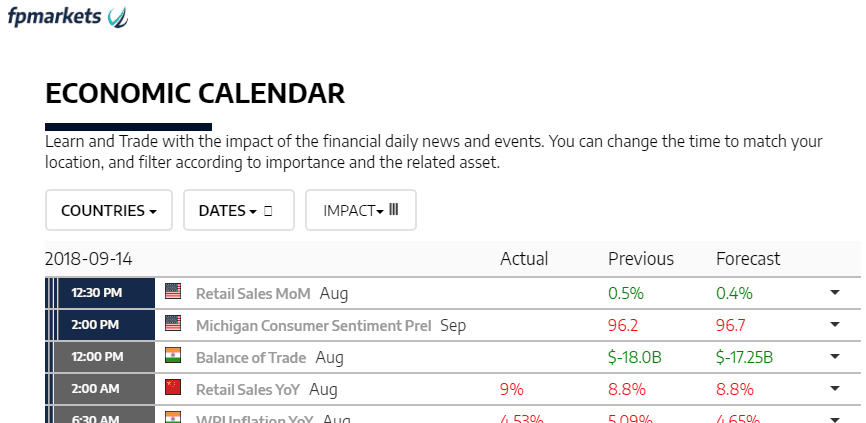
To put it simply , Fundamental Analysis involves the ability to apply information from multiple resources outside of the charts. For example, News and Data Releases through the Economic calendar are the top two sources for conducting Fundamental Analysis.
Tools available for Fundamental Analysis
One of the great advantages of trading currencies is that the forex market is open 24 /5 (from Sunday, 5 P.M. EST until Friday, 4 P.M. EST). Economic Data is one of the most important catalysts for short-term movements in any market, but this is particularly true in the currency market, which responds to economic news from all around the world and in particular the major economies and stock markets.

Key Data Releases
When trading the news, you first have to know which data releases are expected that week. it is also key to know the level of importance of this data and whether it will have a High, Medium or Low impact which also relates to volatility levels it will experience at the time. Generally speaking, these are the most important economic releases for any country:
1. Interest rate decisions
2. Retail sales
3. Inflation (consumer price or producer price)
4. Unemployment
5. Industrial production
6. Business sentiment surveys
7. Consumer confidence surveys
8. Trade balance
9. Manufacturing sector surveys
3. Sentiments Analysis
Market sentiment in its most basic definition, defines how investors feel (emotions) about a particular market or financial instrument. The market as we know it, could potentially move in three directions; Up (Greed), Down (Fear) or Sideways (Uncertainty). As traders, sentiment becomes more positive (Bullish) as general market consensus becomes more positive. Likewise, if market participants begin to have a negative (Bearish) attitude sentiment can become negative.
Tools available for Sentiments Analysis

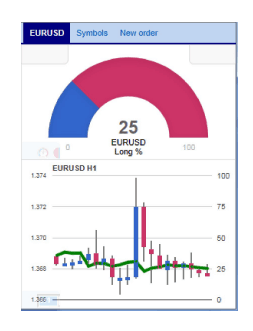
FP’s Sentiment widgets will be able help traders see the correlation between long and short positions held by other traders. They are your basic "bull and bear" signals, that help traders gather insight into the market mood.
Market sentiment is based on real-time data taken from multiple trading service providers by FP’s partnered providers and should be considered indicative only. The widgets are updated in real-time, but note that volume data changes significantly during market moves or when traders close/open positions with significant volume.
About Traders Edge:
FP Markets brings you the powerful Traders Edge Tools which is a suite of twelve online trading tools designed to enhance the trading experience by giving traders the edge as well as insights into the markets. For more information please click here
WEBINARS - Managing Change/Dealing with Adversity - Series of Online Courses

Call Us
AUS: 1300 376 233
INT: +61 2 8252 6800

Live Chat
Chat with sales or support here

You can reach us by Email here

Follow Us
Join Our Community
